Week ended Aug 4, 2023: It's August!
- tim@emorningcoffee.com

- Aug 6, 2023
- 4 min read
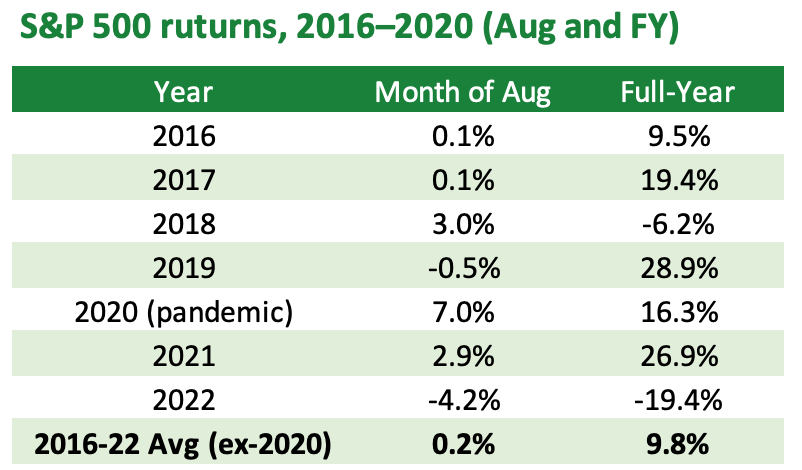
We’re now into August, a normally lower-volume month, and often not the best month for equities. The table below shows August returns for the S&P 500 since 2016 compared to FY returns for the same year. The averages ignore the abnormal year of the pandemic (2020).

Ignoring the pandemic year of 2020, returns have generally been around nil to negative, with 2018 and 2021 being the exceptions. That’s not enough for me to conclude that this will necessarily be a lousy month, although this past week didn’t exactly get things off to a flying start, as US – and global equities – slumped.
The news drivers in brief this past week included:
Eurozone July flash inflation was released last Monday, showing persistently stubborn core inflation (5.5% YoY, same as June) in the common currency zone. Services inflation also ticked higher for the third month running. The data supported the ECB’s decision the week before to increase its benchmark overnight bank rates by 25bps, and certainly leaves the door open for further increases, putting the Eurozone in a precarious position as growth slows and inflation remains elevated.
FitchRatings downgraded the US sovereign debt rating to AA+ from the coveted AAA last Tuesday, a topic I wrote about earlier this week here. The Biden Administration jumped up and down, and many investors also questioned the timing. Having said this, the US has earned the downgrade, and this needs to be a wake-up call to address the sad state of US partisan politics at the moment.
The Bank of England raised its monetary policy rate a further 25bps on Thursday, to 5.25% (Monetary Policy Decision here). This was the 14th consecutive increase in the Bank Rate and was in line with expectations, although there was one member of the MPC that favoured a pause and two others that favoured a 50bps increase (6-3 vote in favour of +25bps). The UK economy remains on a knife’s edge although there are some signs that inflation is subsiding.
Corporate earnings were again a focus of the week. See Refinitiv “This Week in Earnings” here, which provides an overview / summary for this quarter for S&P 500 companies. 422 of the S&P 500 companies have now released their earnings, with 33 additional releases slated for this coming week. Most eyes were focused on Amazon (release here) and Apple (release here) last week, both of which released their earnings after the bell on Thursday. Both had top and bottom line beats although Apple saw its sales decline slightly for the third consecutive quarter, while Amazon was much more positive as far as outlook in the post-earnings release analyst call. Apple’s stock fell 4.8% on Friday, while Amazon’s stock rose 8.3%. Speaking of earnings, below is a summary of performance since mid-July (pre-earnings) and since the beginning of the year for seven tech giants.

The July US jobs report was released Friday morning before the bell (here), with 187,000 new jobs added in July, slightly below consensus of 200,000 (although note that new jobs in both May and June were revised down, by 25,000 and 24,000, respectively). The unemployment rate in July fell to 3.5%. The job report was considered mixed, because although the labour market showed slight weakness in terms of new jobs added, wage inflation did not decrease and the growth rate remains well about the target rate as the graph below from #CNBC illustrates.

MARKETS THIS WEEK
When you mix all of this news together – and keeping in mind the strong across-the-board performance of equities in July – it was not overly surprising to see some consolidation take place in global equity markets this week, as you can see in the table below.

We of course have to consider the time of year and the overall assessment of earnings as the season winds down. Will equities stabalise (again) of will they continue to head south, looking for more reasonable valuation levels that are in line with some of the uncertainties on the horizon?
US Treasuries were especially volatile this week, swinging in line with economic data. Yields finished the week higher at the intermediate and long end of the yield curve, and lower at the (more policy-influenced) short end, as yields settled following the release of the July jobs report Friday morning before the bell. Aa s a result of the change in the shape of the yield curve, the 2y-10y inversion decreased significantly, to -73bps (vs -91bps the week before). Total returns on the 20+ year bond index are now negative YtD (-1.3%), whilst the intermediate index (7-10 year) is only slightly positive YtD (+0.8%).
As far as other indicators, the US Dollar held firm this week (in spite of the Fitch downgrade), oil rose again and is now up 15% MoM (WTI), and corporate credit spreads were wider across the credit curve, in both investment grade and high yield.
If you would like to see details by asset class / market type, go to “The Tables” section below.
THE TABLES
The tables below provide detail across various global and US equity indices, the US Treasury market, corporate bonds and various other asset classes.
Global equities

US equities

US Treasuries

Corporate bonds (credit)


Safe haven and other assets

_________________
**** Follow E-MorningCoffee on Twitter, and please like and comment on my posts right here on my blog. You need to be a subscriber, so please sign up. Thanks for your support. ****


Comments