
Week ended August 15, 2025: markets stagnate second half of week
- tim@emorningcoffee.com

- Aug 15, 2025
- 4 min read
Economic data came and went without much effect, and a new head of the BLS (EJ Antoni, story here on #BBC) – a Trump loyalist with some historically strange ideas – was named by President Trump. Risk investors again said “meh”. I don’t understand it, but as I wrote last week, momentum is trumping fundamental analysis as far as U.S. equities, and you simply can’t fight the animal spirits until they are ultimately broken. Why, when and how this might happen is anyone’s guess.
With respect to economic data, most focus by investors last week was on the release of the July CPI report on Tuesday (report here). You can read and interpret the data however you want because it was in-line enough with consensus expectations that those on the fence in the “tariffs are inflationary / tariffs are not inflationary” debate can lean whichever way they want. My views are twofold. Firstly, core CPI rose to 0.3% MoM in July, higher than June’s core CPI of 0.2% and the highest reading in six months. Secondly, core CPI for July was 3.1% YoY, which remains well above the Fed’s 2% target for inflation. However, the data was benign enough for some pundits – and certainly those in or affiliated with the Trump Administration – to demand “too slow” Fed chairman Jerome Powell to restart lowering the Fed Funds rate at the September FOMC meeting. To be fair, the revisions to the jobs data for May and June were so shockingly bad that it should mean that higher-than-desired inflation data might play second fiddle to concerns regarding the jobs market, or at least that’s what a growing cadre of economists and pundits are suggesting. The CME FedWatch Tool is now predicting with a 93% probability that the FOMC will lower the Fed Funds rate by 25bps at the September meeting. By a narrower margin, the tool is also projecting 25bps reductions in the policy rate at both the October and December meetings.
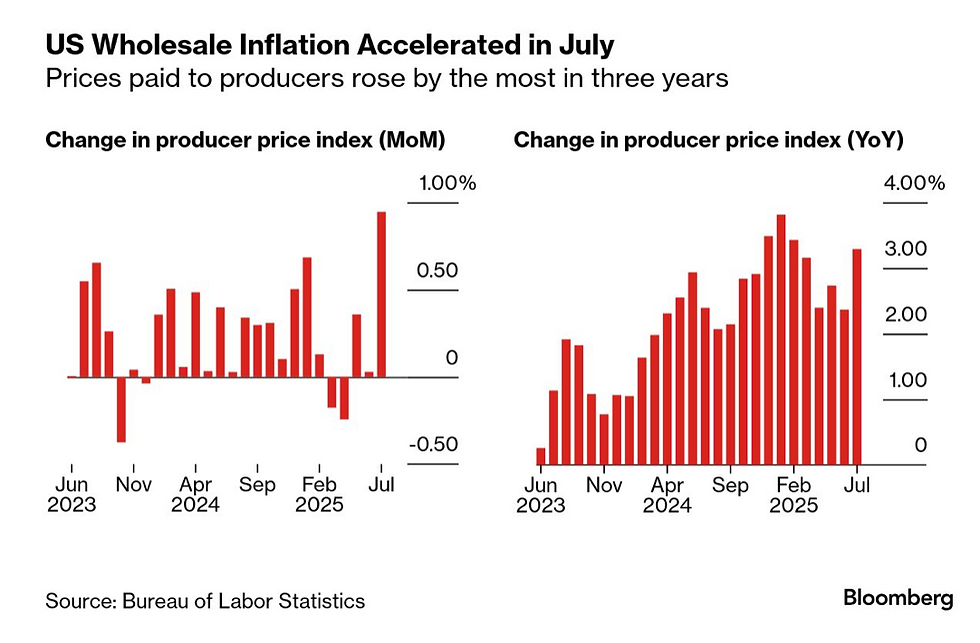
All was well and good until a hotter-than-expected PPI report for July was released on Thursday morning (report here), which gave stocks pause after reaching record highs in the U.S. on Tuesday and Wednesday. The Producer Price Index, similar to the CPI, is a Fed-monitored measure of inflation but from the perspective of producers (rather than consumers). It is often considered a leading indicator for consumer inflation, which is why the report is somewhat concerning. Here is the direction of travel of PPI (from #Bloomberg via the #BLS) over the last few months, both MoM and YoY.
The combination of benign CPI and higher-than-expected PPI did little to reduce expectations of a September rate cut by the Fed, and so animal spirits as far as U.S. stocks and other risk assets continue to run amuck. July retail sales (here) grew 0.5% MoM / 3.9% YoY, better than expected, so consumers are still spending. However, the Michigan Consumer Confidence survey, released Friday (here), turned down in July, perhaps a harbinger of what consumers feel looking forward.
Of course, U.S. stocks are not the only ones running, with good gains recorded in international stocks last week, too. Chinese equities continue to slowly push higher, although the economic data is far from reassuring. Data released last week suggests a slowing Chinese economy, although I suppose this has to be digested in the context of an economy still growing on at 5%/annum. Industrial production and retail sales both fell sharply in July vis-à-vis June, as you can see in the graphs below from #FT, with the property market continuing to be a thorn in the side of the Chinese economy.

The Trump Administration again deferred the implementation of harsh tariffs on China for another 90 days (yawn), which helped sentiment. However, China seems to be constantly bordering on the edge of potential deflation, something I find particularly concerning. Nonetheless, as an investor, I will not bet against China in the long run.
Market summary / tables
Stocks rallied globally, with Japanese stocks leading the gains. Stateside, it was the large- and small-cap stocks that performed the best, outperforming the tech-heavy NASDAQ Composite, the best performing index in the U.S. this year. Yields at the intermediate and long-end of the US Treasury curve pushed higher, even as momentum builds for an FOMC rate cut in September. This reflects concerns over a combination of long-term inflation and U.S. government debt, since bond yields would be expected to be lower as U.S. economic growth comes under pressure. Corporate credit spreads continue to grind tighter, with high yield spreads now tighter again than at the end of last year. If you are an investor that believes U.S. stocks are potentially in a bubble, it would be hard not to think the same about high yield bonds. Both the US Dollar and the price of WTI crude oil continued to weaken.
TABLES
_________________
**** Follow E-MorningCoffee on Twitter, and please like and comment on my posts right here on my blog. You need to be a subscriber, so please sign up. Thanks for your support. ****


Comments