
Week ended Sept 26, 2025: markets drift
- tim@emorningcoffee.com

- Sep 27, 2025
- 3 min read
As we wind down the third quarter of this unusual year, I expect to see higher volatility in the week ahead as fund managers clean up their portfolios to end the quarter and prepare for the final quarter of this tumultuous year.
Most of this past week was characterised by a slow drift lower in U.S. stocks, which was abated on Friday with the release of in-line core inflation data for August. To see stocks cool a bit is not surprising given the heady valuations and the nice run investors have experienced over the last few weeks. The U.S. Treasury bond market – the harbinger of truth of what may lie ahead – experienced higher yields across the curve this week, including at the more policy-influenced short end of the curve. Even Friday’s in-line PCE data did not provide relief for bond investors, which remain far from convinced that long-term inflation expectations have been squashed. Fed officials on the circuit this week presented a mixed picture, although aside from recently appointed Stephen Miran (de facto a Trump appointee), most remain concerned about inflation being "sticky" and remaining above target. In essence, most Fed officials remain somewhat cautious, presenting a picture largely in line with the recently released dot plot (graph extract below) that was enshrined in the revised FOMC Summary of Economic Projections. This chart shows FOMC voting members’ expectations of where the Fed Funds rate will be at the end of 2025 and the following three years. Take a guess as to Mr Miran’s dot at year-end 2025, a level that would be associated with a financial crisis rather than a gradually slowing economy.

What I take away from the dot plot is that FOMC voting members are largely aligned (except for Mr Miran), and that as time passes, there appears to be a consensus around an appropriate policy rate in a balanced US economy of 3% or so.
Some economic data trickled in in the U.S. this past week, all suggesting that the economy remains on relatively firm footing. Consumer spending in August remained robust, and 2Q25 GDP was revised higher this past week although the prior quarter (1Q25) was revised slightly lower. (Recall that the pre-tariff increase (acceleration) in imports in the first quarter largely caused U.S. GDP to be negative, whilst a decrease in imports (post-tariffs) in the second quarter largely caused U.S. GDP to be strongly positive.) Perhaps the proper growth figure to consider is 1H2025 real GDP growth, which was 1.6% annualised, compared to 2024 real GDP growth of 2.8%. PCE data released Friday showed solid growth in consumer incomes and spending in August (trailing data), with PCE core inflation in line with consensus expectations at 2.9%/annum but still well above the Fed’s target. U.S. stocks took this in stride on Friday, suggesting that the in-line core PCE data would not prevent the Fed from carrying on with its easing trajectory at the October and December FOMC meetings (see CME FedWatch Tool). Lastly, some additional U.S. tariffs announced by the Trump Administration Thursday on imported furniture and certain pharmaceuticals led to a muted reaction in markets. Investors have now learned to take everything Mr Trump says with a pinch of salt (thank goodness!). The one piece of concerning
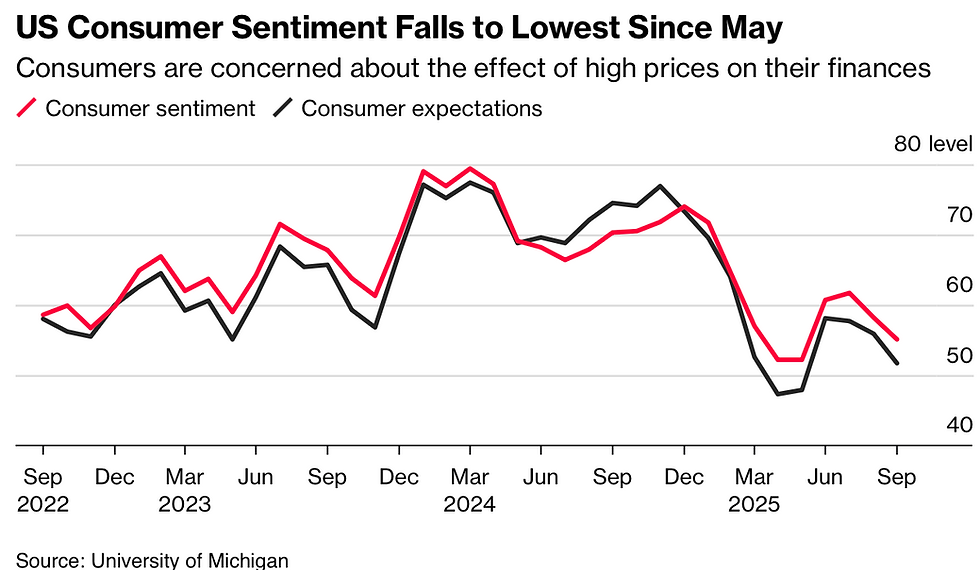
news was that consumer sentiment weakened again in September, according to the Michigan Consumer Sentiment Survey released on Friday.
I view consumer sentiment surveys as important because they take the temperature of the driver of the US economy, which is the consumer (i.e. consumption). Most other economic data, including all the data discussed above (2QGDP, August PCE, etc), is backward looking. The distinction is important because investors care more about what is ahead, both in terms of tariff-effects on corporate earnings and consumer sentiment. This is perhaps not fully reflected in the retail /

momentum driven U.S. stock market, but it certainly is reflected in the bond market, especially concerns about elevated long-term inflation. To the right is another table extracted from the recent University of Michigan consumer sentiment survey which depicts the deterioration in consumers’ views regarding sentiment, expectations, and economic conditions between September and August (one month), and since September 2024 (one year ago). This doesn’t make me feel good about the level of U.S. stocks at the moment, although I recognise there are other drivers pushing in the opposite direction.
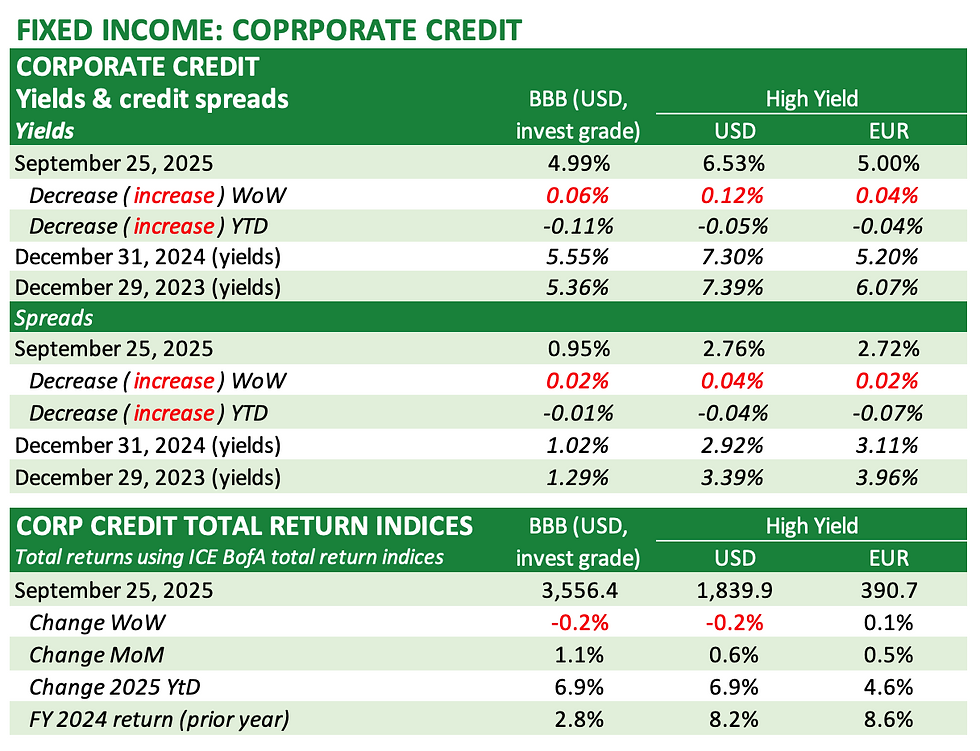
Below are updated market tables for global indices, US Treasuries, corporate credit (corporate bonds), gold, the US Dollar and select other assets.


_________________
**** Follow E-MorningCoffee on Twitter, and please like and comment on my posts right here on my blog. You need to be a subscriber, so please sign up. Thanks for your support. ****


Comments