


Stocks - do they always go up?

Updated: Apr 25
“Invest for the long haul. Don’t get too greedy and don’t get too scared.”
Shelby M.C. Davis
[Originally published March 2022, and updated Feb 2023 and April 2026]
Do stock prices always go up? Obviously not, as investors discover from time to time, most recently perhaps in March when the surprise attack on Iran by the US and Israel destroyed global risk sentiment sending stocks sharply lower. This decline did not last long however, as President Trump declared victory in early April, followed by a two-week ceasefire in the conflict. Since then, the S&P 500 has surged, recovering all of its March losses and soaring to a new record high as investors piled back into U.S. stocks, cheering the apparent winddown of a war even though a resolution looks far from clear.
This sort of quick recovery is unusual in a historical context, but for reasons that I don’t fully understand, has largely characterised the ups and downs of the post-pandemic period. Prior to the pandemic, downturns in stocks were usually more prolonged and severe. I am still not convinced that that the last five+ years is new reality, because these sorts of post-pandemic trends are neither customary nor typical. Having said that, stocks do always go up in the long run. What exactly “long run” means is open for interpretation, but I believe this is at least 10 years. Since 1925, there have only been four 10-year periods in which the return on the S&P 500 was negative, two of which occurred in the late 1930s (effects of the Great Depression), and the other two of which occurred in the late 2000s (joint effect of the dot.com bubble bursting and the Great Recession).
Equities – such as index ETFs, mutual funds or a diversified individual stock portfolio – will almost certainly outperform most other asset classes over long holding periods, although with higher empirical returns comes much greater volatility. Investing in stocks requires incredible discipline, conviction and nerves of steel, especially during difficult periods. The earlier an investor develops a plan and begins to invest in stocks, the better. An investor must learn to resist the temptation to “time the market” by wholesale moves into and out of stocks based on emotion, a strategy that is almost certain to deliver subpar returns over long periods.
I penned the first version of this article in 2022, and have updated it in February 2023 several with more current data (at the time). Not surprisingly, the conclusions have not changed in the last three years. Since my adult children and many of my other readers are in their 20s and 30s, I am hoping reading this article will encourage them to dedicate as much of their earnings as possible to savings, the majority of which should be invested in equities. Needless to say, things like taking advantage of employer-sponsored savings plans with employer contribution matches, saving in plans on a tax-deferred or tax-free basis, and contributing to plans on a pre-tax basis should top one’s list, including programmes like 401k plans in the US or self-directed employer-sponsored pension plans in the UK.
For those with shorter attention spans, let me provide the summary conclusions early in this article, and you can then decide if you want to read further.
Long-term returns for US stocks are “top drawer”: Over long periods of times, stocks have generated attractive nominal and real (i.e. inflation-adjusted) returns for investors. Since 1950 (last 75 years), the compound average annual growth (CAGR) of the S&P 500 has been 11.8%/annum (total return basis), or 8.0% on an inflation-adjusted (real) basis. The nominal CAGR total return on the 10-year US Treasury over the same period has been 5.00%/annum, or only 1.32%/annum when adjusted for inflation.
.....but stocks are volatile year-to-year: Stocks are inherently more volatile than many other asset classes, including bonds. Annual returns on the S&P 500 since 1950 have ranged from a low of –36.6% in 2008 to a high of 52.6% in 1954. The standard deviation of nominal annual returns of stocks over this 75 year period is 17%, which illustrates the volatility of stocks. This means that there is a 68.3% probability in any given year that stocks could deliver a total return in the range of a loss of 5.2% and a gain of 28.8%. Over the last 75 years, returns have been worse than one standard deviation (i.e. less than -5.2%) 12 times, and better than one standard deviation (+28.5%) 12 times.
The longer the time frame, the less likely returns are to be negative: Having said this, there were only 15 years (20%) that returns on the S&P 500 were negative for a calendar year since 1950. If you held the S&P 500 index at least three consecutive years, there were only five such (three year) periods in which stock returns were negative. And if you held stocks 10 years, there have been only two 10-year periods in which stocks were negative since 1950. If you know your financial history, you might not be surprised to learn that these two 10-year periods were 1998-2008 and 1999-2009, both of which captured the nosebleed highs of stocks (tech-driven) in the late 1990s before the bursting of the dot.com bubble (March 2000) and then the Great Financial Recession (“GFC”, 2008-2009), the worst global economic decline since the Great Depression.
Timing the market is a fool’s game: If you fancy yourself to be a timer of markets and had missed the five best years for stocks since 1950, your portfolio performance would be significantly worse than if you had stayed the course. As mentioned above, the nominal return on the S&P 500 over the most recent 75-year period was 11.8%, and the nominal return if an investor had sat out the five best years (1954, 1958, 1975, 1995 and 1997) would have only been 9.5%, a full 230bps less. This might not sound like much, but compounding over long periods of time makes a massive difference. To illustrate, $10,000 invested in stocks at the beginning of 1950 which remained invested throughout the entire period would have been worth nearly $4.3 million at the end of 2025. Over the same period, had an investor sat out the best five years by trying to time the market (and being wrong), the ending pot would have been $900 thousand, which is less than one-fifth of the ending pot had the investor stayed the course.
These are my four major conclusions. If you wish to dig deeper, please keep reading.
Data used to prepare this analysis
In preparing this article, I have used annual total returns on the S&P 500 index for the period 1926 to 2025. The data is from the Ibbotson® SBBI® US Large-Cap Stocks (Total Return), which has been tracking US stock returns dating back to 1926. The data is now updated annually by the NYU Stern School, and you can find stock returns – as well as returns on a number of other asset classes up to 2025 – here.
Four different data periods
I have looked at this data over four different time periods, all ending with 2025 full year data. These periods are:
1926-2025 (100 years), the entire period for which data is available;
1950 to 2025 (75 years), which excludes the Great Depression and WWII, both highly volatile and rather unusual periods for stocks (and markets generally);
1985 to 2025 (40 years), which excludes the Great Depression, WWII, and the high inflationary period of the late 1970s / early 1980s; this also arguably reflects a “normal” holding period for a person’s lifetime;
2000 to 2025 (25 years), which basically includes three significant economic cycles: the “dot.com” bubble; the Great Financial Recession (“GFC)”), and the pandemic period. Keep in mind that since the GFC, the Federal Reserve has used unconventional monetary policy to “regulate” the economy with a fair degree of success (and a few missteps).
Going all the way back to 1925 is a long time ago, which is why I chose to look at a series of shorter, more contemporary periods. Certainly the 40-year and the 25-year periods both better reflect the “evolution” of countercyclical fiscal policy and unconventional monetary policy. Arguably, both fiscal and monetary policy have become more friendly to risk investors, especially since the GFC. Along these lines, stock returns have been unusually exceptional over the last few years.
For less seasoned stock investors, investing in stocks has looked fairly easy since the end of the pandemic, because – aside from 2022 – stocks have been on a roll. However, rest assured that this rather short period of time is not characteristic of longer holding periods for stocks or most other financial assets. Stock investors should anticipate periods of high volatility and negative returns in the future, just like those periods that have been experienced in the past. However, such downturns are not necessarily a bad thing for investors who have both the discipline and understanding to dollar-cost average, adding to their holdings in good times and bad. Buying-the-dip has become the “go-to” for younger investors, but it is very likely that this strategy will become increasingly difficult down the road, resulting in pain for investors that become complacent and over-confident.
How much of an investor’s portfolio should be invested in stocks?
The percentage of a portfolio that an investor should allocate to stocks depends on the investor’s risk profile, which in turn is often dependent on the stage of life of the investor. The allocation of a person’s portfolio to stocks should involve money that is not needed in the near term given the volatility of the asset class year to year. Stocks are an asset class that should be held alongside other asset classes like bonds, real estate, precious metals and alternative assets. Perhaps most importantly, your portfolio should also include enough cash or cash equivalents so that you can pay expenses for six to 12 months without having to liquidate stocks – or any other asset class for that matter – during difficult periods. None of this is revolutionary advice – it is “personal finance 101” – but it is important for me to mention this before digging deeper into long-term returns on equities.
Components of stock returns
The analysis I have done uses total annual returns, consisting of three components: capital appreciation (or depreciation), dividends, and the reinvestment of dividends as they are received. It is important to keep in mind the final component – reinvestment of dividends – turbocharges the compounding of earnings over time.
Nominal returns, real returns and standard deviation of stocks
The table below shows compound average annual returns (nominal and real) and the standard deviations for four periods.

Real returns and volatility for stocks (the last two columns from the right) had been trending in the right direction over the first three rather long periods. However, looking at the most recent shorter period (25 years), returns have been substantially lower and slightly more volatile, slightly counter-intuitive given some of my earlier comments on fiscal and monetary accommodation during this period. However, the last 25 years contains some exceptional economic events.
Stock prices doubled between 1996 and 1999, but then had three consecutive years of negative returns (2000, 2001 and 2002) as the dot.com bubble deflated and the US entered a recession. With stocks heavily over-valued leading into 2000, stock prices plunged once the bubble began to deflate. In fact, stocks did not return to the level that they closed 1999 until 2006, just in time for the onset of the worst recession since the Great Depression.
In 2008, stocks lost one-third of their value in a single year, although this time, stock returns quickly bounced back into positive territory the following year (2009). However, it took stocks five years to return to the 2007 closing level, even with the Fed unleashing unconventional monetary policy measures including 0% interest rates and quantitative easing. These policies continued well after the GFC for several years, and then were reintroduced during the pandemic. Not surprisingly, stocks have had only two down years – 2018 and 2022 – since the GFC.
During the pandemic year of 2020, stocks were highly volatile but still managed to chalk up double-digit returns in spite of the fact that the US economy was closed for several weeks that year. The unexpectedly fast recovery was due to a combination of the Fed returning to its very accommodative monetary policy (interest rates lowered to effectively nil as quantitative easing was redeployed) and a host of fiscal stimulus policies – first under Mr Trump and then Mr Biden – to reignite economic growth. This policies were highly stimulative for risk assets like stocks but not necessarily representative of the path forward.
There are a lot of unusual factors that characterised the 2000-2025 period. For this reason, I believe that analysing stock returns, and investor behaviour / patterns are best done over longer periods of time. I also believe that the most representative period of time is the third one – the 40 years starting in 1985. This is also normally the length of an investor’s accumulation period during their lifetime.
How have stocks done compared to other assets?
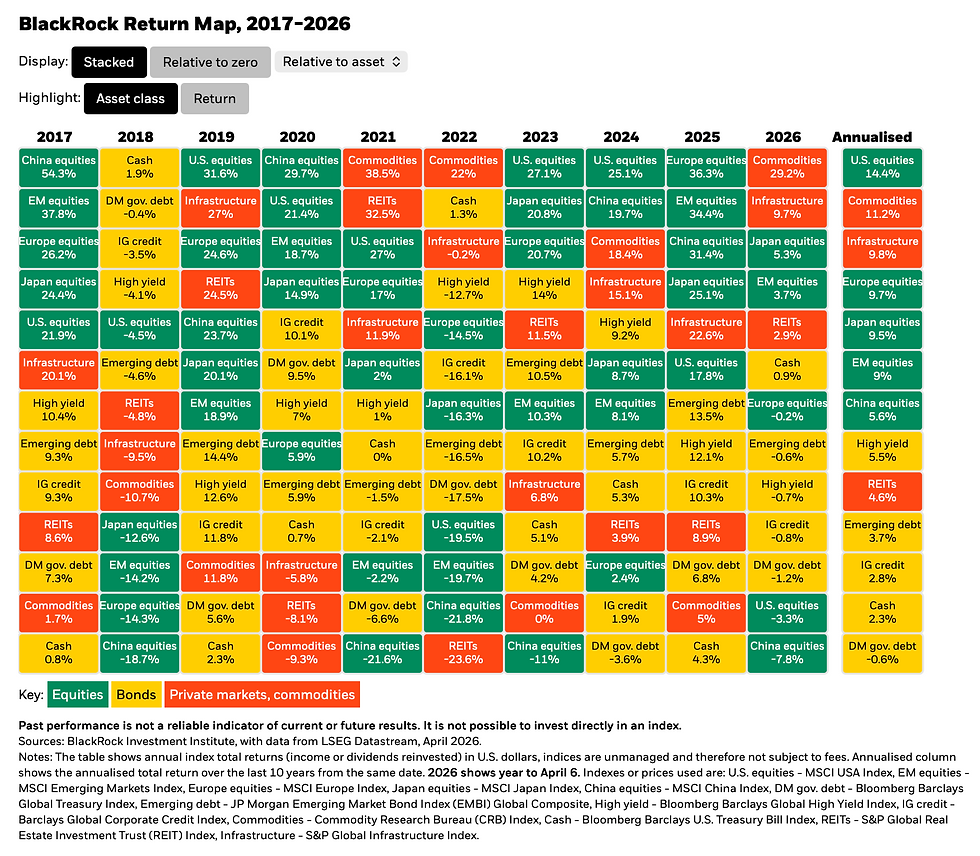
The table below from Blackrock (here) contains a broad array of asset classes and is more contemporary, containing data for a variety of assets classes over the last 10 years. Although the time frame is short, the table still clearly illustrates the superior performance of stocks as an asset class vis-à-vis other asset classes and non-US stock markets. You can see a summary of the performance on an annualised basis of the various asset classes in the right-most column.
The holding period matters a lot
Although returns on stocks can vary sharply from year-to-year, ranging from highly negative to highly positive, returns are more likely to be positive the longer the holding period. The table below illustrates this reality for the four periods I have used in this article. Returns are summarised on an annual basis (1-year column) and are also presented over rolling periods of three-, five- and 10-years[1]. For example, over the 75-year period starting in 1950, I looked at the 10-year average annual return for stocks over 65 periods, meaning the first period was the 10-years ended 1960. The results of this analysis are summarised in the table below

As you can see in the table, the longer the holding period, the fewer the number of periods that stocks were negative over that period. This is true for all four periods, even the challenging 2000-2025 period. The fact is that the longer your time horizon, the less likely you are to have a negative return on your stock portfolio. Perhaps more interesting is that returns have only been negative for two consecutive years on three occasions since 1950: 1973-74; 2000-01 and 2001-02[2]
Of course, I am fully aware that the investment time horizon for investors – especially since the pandemic – has almost certainly gotten shorter, bolstered by unprecedented amounts of pandemic-related stimulus. Even the pandemic year (2020) was a positive year. In fact, since 2019, stocks have had only one losing year (2022) and have generated an impressive nominal CAGR of 18.2%/annum. This looks like easy money and has emboldened investors to pile into equities on the basis that “stocks go up every year”. For many though, 2022 was a stark reminder that equities can be highly volatile and that returns can most certainly be negative. 2026 was off to a difficult start, too, but the “end” of the war with Iran seems to have inspired investors for reasons that are difficult to explain. Even so, U.S. stocks are in the black YtD.
The most important thing you can do as an existing (or for that matter prospective) investor in the stock market is to do a “gut check” and make sure you can emotionally withstand periods of high volatility and downturns, which can last weeks, months or even years, not just days. The “buy the dip” mentality that became so prominent during the pandemic, lost steam in 2022. However, this was short-lived as investors piled back into stocks starting in 2023, with momentum investing being the key style. It is hard to argue that this approach was not effective, given the performance of stocks during the 2023-2025 period.
Timing the market / “day trading”
The final thing I wanted to address is market timing. All investors – including this one – believe that they have a knack for knowing when equities will rise and fall. And all investors eventually realise that

calling the highs and lows is hard work, and can be costly. Remember my opening statement in this article: over the long-run, stocks always go up. The table below has returns for the five best and the five worst years since 1950.
If you fancy your ability to time markets, the table below illustrates the hypothetical cost of being fully invested in stocks but missing out the five best years since 1950 because you moved out of stocks in those years, perhaps incorrectly anticipating a downturn.
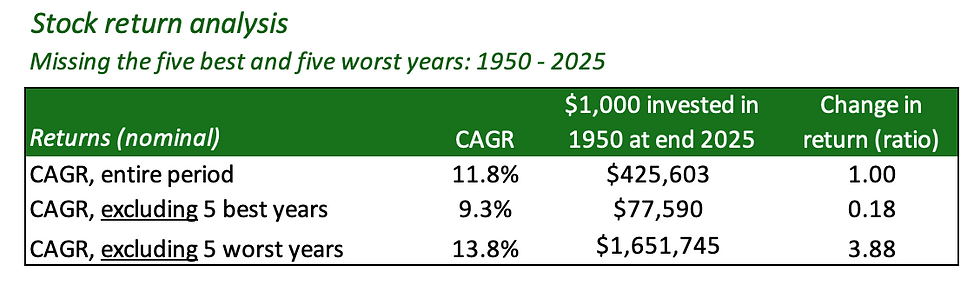
If you consider yourself to be unusually gifted as far as calling the inflection point, I have also showed how much better you would had done if you had sat out the five worst years. I will just leave you with this thought: good luck trying to time the market!
In fact, unless you have a near prophetic ability to call the highs and lows, the best thing is to stay invested rather than trying to time the market, embracing strategies like dollar-cost averaging and reinvestment of dividends. This doesn’t mean you should be completely passive, but rather should fine tune your holdings / allocation from time to time to get in front of economic, company or macro / secular trends. If you have the urge to trade, then segregate a small portion of your portfolio to trade actively “on the side”, but do not get it confused with a core portfolio of equities whether individual names, mutual funds or ETFs.
________________________________________
**** Follow E-MorningCoffee on X, and please like and comment on my posts right here on my blog. You need to be a subscriber, so please sign up. Thanks for your support. ****
[1] The three-, five- and 10-year periods are calculated using compound average growth rates.
[2] Note that the consecutive 2-year periods of 2000-01 and 2001-02 mean that stock returns were negative for three consecutive years, from 2000 to 2002.





Comments