


Portfolio update: 1Q2026

The first quarter of 2026 was a difficult quarter for investors. The year started reasonably well although there were concerns lurking in the background, mainly around huge (and growing) A.I. capital expenditures/investments by hyper-scalers and private credit “cockroaches” (which has turned out to be more of a liquidity than a credit issue, at least so far). The attack by the US and Israel on Iran in late February caught investors wrong-footed, sending oil prices sharply higher and risk assets sharply lower. In addition, the inverse correlation between stocks and bonds again broke down as higher oil prices led to higher inflation expectations, sending bond prices tumbling (and yields higher). At the end of the day, there were few places to hide. U.S. assets continued to be the worst performers on a relative basis in the first quarter, although the ongoing war will likely prove more problematic as far as inflation and economic drag in Europe and Asia than in America.
I tweaked my portfolio early in the year, tilting slightly into more defensive names (utilities, consumer non-discretionary, healthcare) while taking some money off the table in names that had been running like AMZN, GOOG and AAPL. I also lightened on corporate investment grade bonds (ETF). There was a one-time cash inflow into my portfolio related to the sale of a property in early January, and this needs to be considered when looking at the composition of my portfolio at the end of the first quarter compared to year-end 2025. The proceeds of this real estate sale were invested fully in a nine-month UST bill, awaiting possible deployment into other real estate (TBD).
My blended first quarter return across my portfolio (excluding alternative assets) was -0.1%. with income from dividends and interest (0.5% yield in the quarter) offsetting almost all of the capital losses on my portfolio. Given the backdrop and my portfolio mix, I was satisfied with this performance.
Context: performance of market assets and indices in 2025
The investor pain in the first quarter was severe in stocks and bonds, with most U.S. stock indices (especially the tech-heavy NASDAQ) and Bitcoin being the worst performers. Bonds were mostly flat. Gold, the FTSE 100, the NIKKEI 225 and the Russell 2000 (US small cap index) served up modest gains. Not surprisingly, energy-related stocks soared, and the US Dollar rediscovered its mojo as investors moved into the greenback as a safe haven. The table below illustrates returns in the 1Q2026.

My portfolio allocation
My portfolio at year-end was 71.3% equities, 5.6% corporate bonds (mostly corporate IG and floating-rate HY, i.e. leveraged loans), 5.1% gold, 4.3% alternative assets, 9.1% government bonds > 3 months maturity, and 4.7% cash / USTs < 3 months maturity. Compared to the end of 2025, the percentage of my portfolio in stocks was meaningfully lower, caused by slight value erosion but more attributable to a higher allocation into UST bills > 6 months maturity. Recall that I closed on the sale of real estate in January 2026, and 100% of these proceeds were used to purchase a nine-month UST bill as a safe “bookmark” for future deployment back into real estate. As a result of this transaction, comparing my portfolio mix at year end 2025 to the end of the 1Q 2026 is somewhat like comparing apples to oranges. With this caveat, the table below contains my asset allocation as of March 31, 2026.

As my readers know, my portfolio mix changes very little over time. Even at my age, stocks remain the core of my investment portfolio, although I did take money off the table on some runners in early January, reallocating these proceeds to what I considered to be more defensive names.
Equity portfolio: key positions
The table below illustrates my top 10 equity positions as of March 31, 2026, along with some valuation metrics of each stock (two right-most columns).
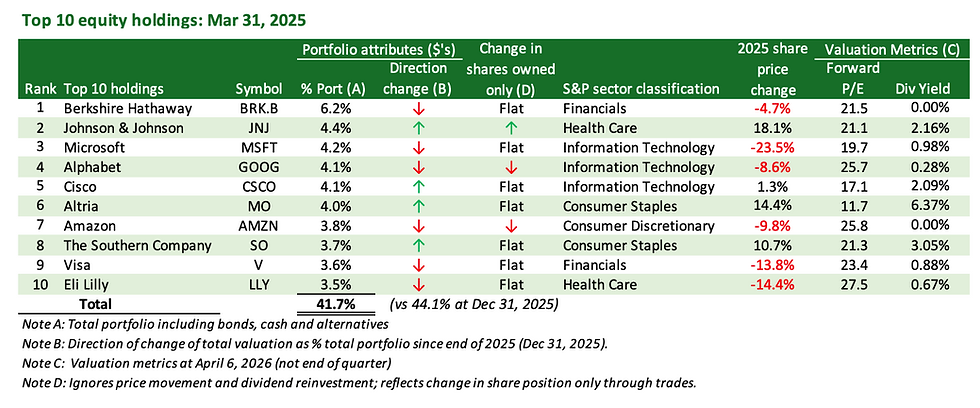
This table provides a fairly accurate picture of both price action and my portfolio alterations in the first quarter, which were relatively modest. I lightened on several large tech names in early January that had run significantly in 2025, and added to several defensive names. Among my Top 10 holdings, I sold small amounts of both GOOG and AMZN, and I added to JNJ which interestingly moved from my ninth largest holding at the end of 2025 to my second largest holding by the end of the first quarter. The logic for these trades was mainly wrapped around relative valuations. Tech names were looking increasingly expensive, and healthcare names – certainly JNJ – looked “safer” and relatively more attractive. The other driver of changes among my Top 10 stocks was price action. Defensive names like JNJ, MO, CSCO and SO powered higher in the first quarter even as tech names were getting slammed. Interestingly, no stocks entered or left my top 10 holdings between the end of the year and the end of the first quarter. Lastly, note that BRK.B continues to be my top position, although I have been working it down over the last couple of years in order to reduce its concentration in my stock portfolio.
The table below shows my top 5 best and worst performing stocks in the first quarter.

Not surprisingly, the war in Iran sent energy and commodity company stocks sharply higher in March, reflected in the table – three of my top five best performers in the first quarter were in those sectors. ASML continued to be a beneficiary of massive amounts of A.I. investment by tech companies, claiming the third position. It is also worth noting that three of my top five best performers are not U.S.-based companies.
As far as the worst performers, MSFT has been a big disappointment and a painful position for me this past quarter. However, with a forward P/E ratio of less than 20 and nearly a 1% dividend yield, I like MSFT at a level below $400/share. On two occasions in the first quarter, I added small bite sizes to my existing position.
Another poor performer in the first quarter was CRWD, a stock with which I have an ongoing “love/hate” relationship. I want to own something in the cybersecurity business because I think the threat going forward will only dramatically increase. CRWD has been massively overpriced at times, and I reduced what at the time was a fairly significant position in early 2025 as a result (arguably a bit too early in retrospect). However, I kept a toehold position so that I could continue to monitor the company’s performance, and took the opportunity to rebuild a more meaningful position when the price of CRWD fell into the mid-$300 area in February. It is no longer a large position in my book, but I will add more if the stock re-weakens because I want some exposure to this sector. (As a health warning, the stock is highly volatile and could face threats from A.I.)
One last thing worth mentioning is that I took a bit of money off the table towards the end of March in XLE, the energy ETF that rocketed higher after the Iran war started. I will always hold energy stocks as a cornerstone of my portfolio, but the price of XLE had risen so quickly that I thought it would make sense to lock in some profits.
Equity portfolio: sector analysis
The table below illustrates my stock holdings by sector. This tables excludes ETFs that are geographically focused (e.g. ETFs focused on Japan, China and Europe), and includes gold ETFs in the “Materials” sector.

Information technology remains the largest sector exposure I have by far. This important albeit volatile sector actually increased in relevancy in my portfolio in the first quarter even as prices of the hyper-scalers were under severe pressure. This counter-intuitive movement was mainly because of the strong performance of CSCO and ASML, and also the fact that I added to CRWD in the first quarter. (Keep in mind that neither GOOG nor AMZN are in the Information Technology sector.)
The other sector changes in the first quarter were largely attributable to shifting investor sentiment. Not surprisingly, prices of companies in the energy and materials sectors increased in relevancy because of the war-generated strength in energy and commodity shares in March. More defensive sectors like consumer staples, healthcare and utilities also were beneficiaries of shifting investor sentiment.
Equity analysis: geographic exposure
My equity portfolio continued to drift towards non-US based names in the first quarter, mainly because of the continued relative outperformance of non-US stocks rather than conscience reallocation.

Equity hedges
I continue to occasionally write covered calls on individual stock positions when valuations get “toppy”, and to carry a series of stock index puts. At the end of March, I held QQQ (NASDAQ) puts expiring at the end of June, September and December, as downside protection. It’s fair to say I am not fully comfortable with the bounce that markets have experienced since the end of the quarter.
Fixed income portfolio analysis
The table below contains a breakdown of my fixed income and cash holdings at the end of March 2026. My allocation to fixed income increased significantly in the first quarter, approaching 20% of my portfolio. I consider this unusual and primarily attributable to the inflow of proceeds from the sale of real estate in January, which was invested in a UST bill due in September 2026.

Corporate bonds decreased as a percent of my total portfolio in the first quarter, as I took some money off the table in a US investment grade corporate bond ETF. Higher interest rates also pushed values of intermediate duration bonds down slightly.
Portfolio returns
My (non-annualised) return in the first quarter across all of my portfolios was more or less flat, with valuation erosion leading to a 0.5% loss, offset by a portfolio yield of roughly the same amount. My Sterling-denominated UK portfolio performed slightly worse than my USD-denominated portfolios (in USDs), reflecting the strengthening of the US Dollar and the relatively worse performance of European and Asian stocks. Both of these trends can be attributed to the start of the US-Iran war. In general, I feel reasonably good that it has not been worse, especially given the poor performance of most asset classes and indices in the first quarter.
What’s ahead
The market has bounced back sharply in the first half of April, much to my surprise. I will continue to watch names that might get expensive if this recovery continues unabated, simply because I don’t have as quite an optimistic view as it appears many stock investors have at the moment. Having said that, changes to my portfolio are generally “around the edges” as I am simply not an “in and out” investor.
_________________
**** Follow E-MorningCoffee on Twitter, and please like and comment on my posts right here on my blog. You need to be a subscriber, so please sign up. Thanks for your support. ****


Comments