
Last Week and the Week Ahead (May 11-15)
- tim@emorningcoffee.com

- May 10, 2020
- 6 min read
Updated: Jul 19, 2020
I appreciate any feedback you wish to provide on content, length, etc., on any of the posts on this blog, either by commenting below the post or emailing me at tim@emorningcoffee.com. I very much value the opinions of my readers as I try to develop this website / blog and am particularly interested in knowing if you find the weekly update (mainly a lookback) interesting.
I am always open to topics and welcome guest bloggers. Don’t forget to follow emorningcoffee.com on Twitter.
Summary
Economy: The U.S. posted its worst nonfarm payrolls and unemployment figures since the Great Depression, according to Bloomberg, with job losses coming in at 20.5 million workers and unemployment skyrocketing to 14.7%. May is expected to be even worse.
Earnings: 430 of the S&P 500 companies have now reported their most recent quarterly results, and around 67% of companies have beaten consensus expectations (which is about the norm). On an absolute basis, earnings for 1Q20 vs 1Q19 are down 12.0% and are expected to be down nearly 41% the next quarter (revised down from last week’s consensus for 2Q of -38%).
Equity & Credit Markets: The global equity and debt markets don’t seem to care about poor earnings and an ever-worsening economic outlook, as both continue to show astonishing resiliency. I think it’s a “Fed put”, meaning that the unprecedented liquidity and ever-broadening scope of QE from the Federal Reserve is firmly underpinning financial asset prices. All of the equity market indices I track were solidly up last week and gained momentum as the week wore on.
"Risk-Off Assets": Risk-off assets are more or less moving sideways, even though investors seem to have a “risk-on” attitude at the moment. The 2-10 year UST spread is widening, yet another bullish economic indicator that is difficult to understand especially with the Fed’s massive QE programme.
Oil: The price of WTI crude oil nearly doubled from just two weeks ago but remains at a depressed level of just below $25/barrel.
Global Equity Markets
Global equity markets were positive across the board last week, as sentiment improved compared to the rather lacklustre tone the week before.
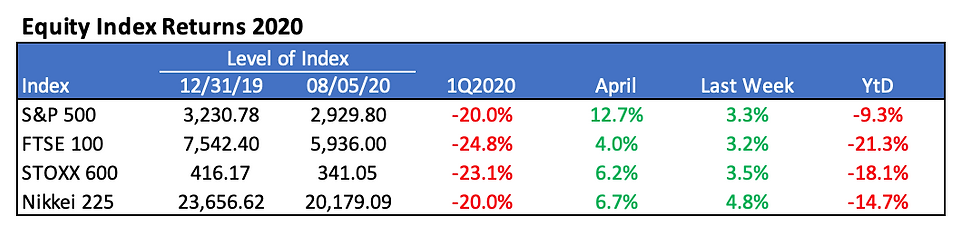
As widely reported, the tech-heavy NASDAQ turned positive for the year last Thursday. Looking at broader indices, the table below elaborates more on the retracement of the major equity markets since most reached their trough on / about March 23rd.

As it illustrates, the S&P 500 has recovered over 60% of its losses from its trough on March 23rd. The S&P 500 is only 13.5% off its February 19th peak, and less than 10% below its level at the end of 2019, an amazing recovery given the backdrop.
Credit Markets
Credit markets were little changed on the week. The investment grade market was a few basis points tighter, whilst the BB and B high yield indices widened 10-12 bps.

Now that credit spreads have decreased from March highs and largely stabilised, the focus can shift to the huge amount of new primary issuance in the US dollar corporate bond market. The Federal Reserve’s commitment to buy investment grade corporate debt, bonds from fallen angels and high yield ETFs has provided a firm floor to the market, even if it is unclear just how much of this debt the Fed has actually purchased. According to data from SIFMA, corporate debt issuance denominated in US dollars was up nearly 69% through the end of April. I could not find recent similar data for EUR-denominated corporate bond issues, although I suspect that EUR-denominated investment grade volumes are also robust.
There have been numerous examples recently of impressive new issues in the corporate bond market, but a very recent example is the $25 billion multi-tranche (7 tranches, 3 to 40 years) issue from beleaguered Boeing Corp (Baa2/BBB-/BBB) announced on April 30th. This multi-tranche mega-issue was the 6th largest investment grade bond and the largest non-M&A related bond ever. Whilst the sheer size of the Boeing issue shows the power of the unprecedented liquidity being provided by the Federal Reserve, it is even more impressive when considering that Boeing was reportedly on the doorstep to request a federal bailout from the U.S. government before the company’s successful mega-bond issue.
Earnings for S&P 500 Companies
430 of the S&P 500 companies have now reported earnings for the first calendar quarter, and according to Refinitiv, 67% of companies have beat consensus expectations. With over 80% of companies having reported, 1Q2020 earnings are now expected to be down 12%. Current consensus for 2Q20 are for earnings to be down a whopping 40.8%. The weekly earnings report from Refinitiv is thorough, and it can be found here.
In terms of valuation Refinitiv calculates the forward P/E ratio (2Q20-1Q21) for the S&P 500 based on consensus earnings, and Yardeni Research does the same. Based on their respective earnings estimates for the S&P 500, Refinitiv calculates the forward P/E ratio to be 22.0x, and Yardeni calculates it to be 20.4x. Working with this range and to provide some

context on current valuation, Factset calculated the average forward P/E ratio for the past five, 10, 15 and 20 years in a recent article dated March 14th 2020, and these averages – which are in the table to the left - suggest that the S&P 500 is currently well ahead of itself based on a traditional price-to-expected earnings model.
Economic Releases that Matter (and Central Bank statements)
The big news last week was U.S. nonfarm payrolls (20.5 million lost jobs) and unemployment (14.7%) for April, both numbers unimaginable before the pandemic. Even so, it was expected to be bad, so the equity and bond markets more or less said “who cares?” and rallied the following day! Again, it’s the Fed put in action, underpinning financial assets.
The Bank of England released its policy statement mid-week, which you can find here. The BoE left the overnight borrowing rate unchanged (at 0.10%) and its QE programme on target, but it was the closing statement that caught most people’s attention. The BoE said:
“The MPC will continue to monitor the situation closely and, consistent with its remit, stands ready to take further action as necessary to support the economy and ensure a sustained return of inflation to the 2% target.” In other words, the BoE has fallen in line with many other central banks, saying it would do whatever is necessary to blunt the effects of the COVID-19 economic slowdown. As might be expected, the FTSE rallied and Sterling weakened (albeit short-lived) after the BoE released its update.
Risk Off Assets and Oil
Gold and the Yen more or less moved sideways last week, even as investor sentiment increasingly shifted towards “risk on”. As far as US Treasuries, the yield on the 2-year UST declined whilst the spread on the 10-year UST widened. In fact, the 2-10 UST spread has widened from 38bps two weeks ago to 53bps at Friday’s close. The steepening yield curve, which is a forward indicator of stronger economic growth, might be viewed as yet another sign of the current “risk-on” sentiment and seems to be occurring in spite of the Federal Reserve’s influence (via QE) in the US Treasury market. It is worth noting, however, that even if sentiment feels more “risk on” at the moment, gold in particular continues to hold its own as investors look for ways to protect against future inflation. Also, it must be remembered that the Fed’s accommodative policies seem to lift the prices of all financial assets.
As far as oil, the price of WTI crude oil closed the week at $24.74/barrel, nearly double its closing price less than two weeks ago (on April 27th). My view remains that WTI needs to be a minimum of $45/barrel (and that is a minimum) to achieve the objectives of the U.S. (oil independence), OPEC (reasonable budget deficits), and other oil producing countries.
COVID-19 update
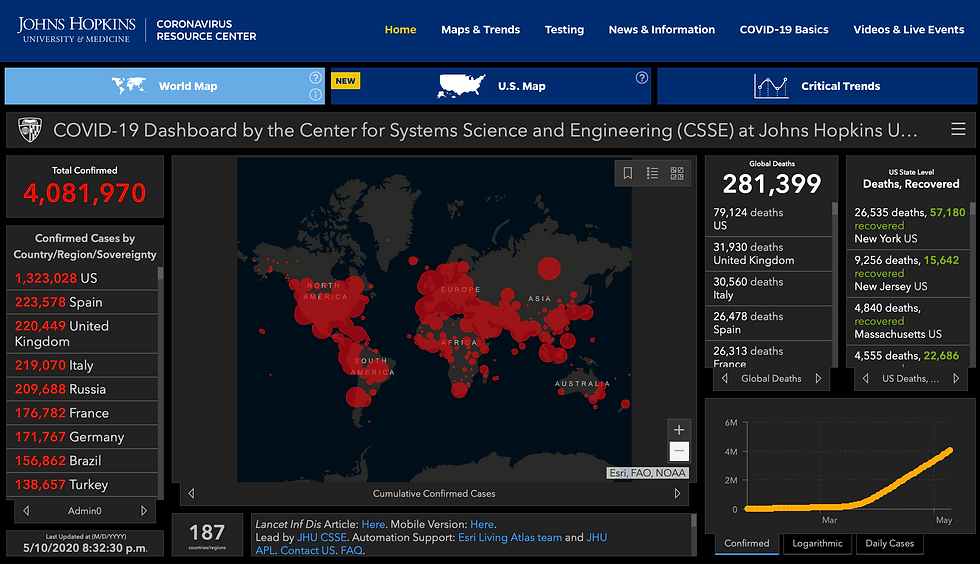
Below is the table showing the monthly progression of COVID-19 cases and deaths globally, with cases now over 4 million globally and deaths approaching 300,000 people.

The U.S. (79,124 deaths) and the U.K. (31,930 deaths) have the rather dubious distinction of having the most deaths globally from COVID-19, although the U.K., Italy, Spain, France and several other countries are worse than the U.S. (at least so far) in terms of deaths per capita.
Various countries and states are reopening their economies. PM Boris Johnson addressed the British population last night and outlined a very slow and methodical plan for gradually reopening the British economy. Below is the map from Johns Hopkins University illustrating the current state-of-play of COVID-19.
#economy #covid19 #earnings #equitymarkets #stocks #bonds #politics #capitalmarkets #boeing #yardeni #refinitiv #investments

Comments