


A look back during the pandemic: sector ETFs
- tim@emorningcoffee.com

- Aug 18, 2021
- 5 min read
With a good perspective on history, we can have a better understanding of the past and present, and thus a clear vision of the future." — Carlos Slim
It’s a relatively quiet August, so there is no better time to look back at returns of some indices, sectors and asset classes since the early days of the pandemic. This sort of analysis is retrospective of course and raises all kinds of thoughts along the lines of “if only I had done this or that at some specific point”. However, the information contained in this article is not meant to make you think these thoughts, but rather to help you (and me) better understand returns since the beginning of the pandemic and its darkest days (from a market perspective) and over longer periods. By understanding these, investors might be able to position their portfolios to benefit from the next major shift in sentiment that will inevitably occur.
The first thing at which I will look is sector themes involving Exchange Traded Funds, or ETFs, which I have written about several times in the past:
ETFs and Passive Investing, Feb 19, 2020
Playing the Sectors via ETFs, Mar 25, 2020
Sector Performance Post-Market Recovery, May 29, 2020
The third article is an update of the second, and if you need a foundation for sector ETFs, I suggest you read the second one for background. In this article and in the two latter articles on ETF sector funds, I focused on the 11 major sectors created by S&P and MSCI (more information on the sectors here). Several large asset managers sponsor a variety of sector ETFs, including the likes of Blackrock, State Street and Vanguard. For purposes of this analysis, I have focused on the sector ETFs created by State Street Global Advisors (SSGA), known as SPDRs. I wanted to first look at how these 11 sectors have performed, not only since I wrote the initial articles, but also over various pandemic-related periods as well as over longer periods. To set the stage, the table below presents the top 20 stocks in the S&P 500 by market-weight (as of mid-day August 17, 2021), along with the ETF sector to which the stock is allocated and the relative weighting by percentage of the sector ETF to which the stock belongs.

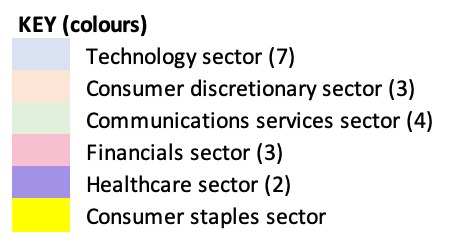
These 20 companies account for just over 37% of the total S&P 500 stocks and are spread across six of the 11 sectors. Perhaps not surprisingly, technology is the largest as far as the number of companies with seven. Five sectors have no companies in the top 20 S&P 500 companies: energy, materials, industrials, real estate and utilities.
The two tables below set forth the 11 sectors and the S&P 500 SPDR (as an index proxy), with returns over four broad periods:
FY2020 by quarter and full year (total return over period)
FY2021 by quarter and YtD (total return over period)
Pandemic periods - pre-pandemic (since end of 2019) and since the pandemic-lows on March 23, 2020 (total return over period)
Returns over longer periods: 5 years, 10 years, and since 2000 (21.6 years) (compound average growth rate/annum throughout period)
The best performing sector in each period is in green, and the worst is in red. Also, it is important to keep in mind that the returns reflect changes in the market prices of the ETFs only, excluding dividend payments, an important total return component for many defensive sectors like energy and utilities.


Focusing first on the periods during the pandemic, it is fairly obvious how sentiment shifted during the six quarters since the pandemic began. For example, energy went from the worst to the best performer (3Q20 to 1Q21) during the pandemic, as fears about economic growth gave way to optimism about stimulus-fuelled growth. Also, technology went from the best performer for 2020 to middle-of-the-pack in 2021 YtD as investors shifted from WFH beneficiaries (many tech-related) to companies that would benefit from a cyclical recovery. Having said this, technology has clearly been the star performer over longer periods of 5- and 10-years. Energy and financials appear to be duds over the longer periods, although it is important to keep in mind that oil prices tend to have their own cycles that don’t necessarily match economic cycles. Also, the energy sector has the highest dividend payout ratio of all sector groups, at least currently. Financials also suffered significantly during both the GFC and the opening stages of the pandemic. Since the GFC, solvency has become much less of an issue but returns in a very low interest rate environment have weighed on financials for more or less 12 years running, albeit the current near-nil interest rates creates a particularly challenging environment.
Perhaps the tables below do a better job of highlighting the best and worst performing sectors in 2020, 2021YtD and since pandemic lows, as well as over the longer periods presented earlier.

The first table more clearly shows the sector rotation that occurred as the pandemic progressed. Initially, pandemic-beneficiaries like e-commerce, streaming companies, gaming companies and computer / gadget companies benefited the most, whilst cyclicals suffered the most. Recall that the technology, consumer discretionary and communications services sectors include all of the FAMAG stocks and the payment companies (Visa, Mastercard, PayPal). However, as the pandemic wore on and we moved into the new year, it was two of the most out-of-favour sectors that suddenly showed life – energy and financials. Both sectors had been hammered during early stages of the pandemic, and both benefitted from rotation into the so-called “reflation” names as the US, and more broadly the global economy, regained momentum. I find it particularly telling to see that the three worst sectors in 2020 have (so far) become the best performers so far this year. If we start the analysis at the pandemic low point (March 23, 2020) rather than the beginning of 2020, the three worst performing sectors – healthcare, utilities and consumer staples – are notably also the most defensive sectors, the exact opposite of the “go-go” momentum names that have generated huge returns in some cases since pandemic lows. It is bold to say this, but I would not be surprised to see these three underperforming sectors being the next ones to benefit as the economy normalises, a prediction that might be even more likely if there would be a serious market wobble in the coming months.
I also looked at valuation metrics of the ETF sectors, which were included in the last update article I wrote on May 27, 2020. The tables below contain updated data as of August 13, 2021 so you can compare some of the valuation metrics in these tables to the tables that were last updated in May 2020, early in the pandemic (and a time when much of the world’s economy was shuddered).

As far as AuM, four of the 11 sectors have more than doubled in size since May 2020, and these most certainly are not the four you might be expecting: industrials (147%), financials (137%), energy (105%) and healthcare (103%). However, although these four are all part of the largest five sectors (by AuM) in the SPDR sectors, the largest sector by far is technology. Technology also has the largest weighting in the S&P 500 index, representing 27.6% of the index, more than double the next largest representative sector (healthcare at 13.4%). Aside from this, I will let the tables speak for themselves, although you should note that – not surprisingly – valuations have increased fairly significantly across the board during this period, just as have the broader market indices. In the coming days, I will prepare a similar analysis on the indices and other asset classes I cover each week in the weekly update.
**** Follow E-MorningCoffee on Twitter, and please like and comment on my posts right here on my blog. You need to be a subscriber, so please sign up. Thanks for your support. ****


Comments