
The 2021 Trump Administration Budget
- tim@emorningcoffee.com

- Feb 12, 2020
- 7 min read
Updated: Jul 19, 2020
On February 10th, the Trump Administration presented its 2021 budget. The budget documents include projected expenditures (by agency) and receipts for the period 2021-2030, as well as the resulting annual deficit and corresponding change in federal debt each year. If you want to read the proposed budget and dig into the details, the official document can be found here. It’s worth quickly leafing through it, in particular focusing on the opening letter from President Trump (pp. 1-3) and the projections / supporting figures at the back of the document (pp 109-128).
Let me summarise what I will present in this post:
According to the proposed Trump Administration 2021 budget, the federal deficit is expected to exceed $1 trillion in 2021, the second consecutive year of record deficits. After 2021, the deficit is projected to decrease each year.
Federal debt is projected to increase from just under $24 trillion at the end of 2021 (106.4% of GDP) to around $30 trillion by 2030 (83.6% of GDP). 76%-78% of federal debt will be held by the public, with the balance held by federal agencies and other government bodies.
Federal government expenditures for 2021 will be $4.8 trillion, and receipts will be $3.8 trillion (resulting in a deficit of nearly $1 trillion).
The Congressional Budget Office (“CBO”), an independent non-partisan agency reporting to Congress, has a more conservative view on the economic outlook for the U.S. economy during the 2021-2030 period. The CBO (average 1.7%/annum) is projecting lower real GDP growth than the Trump Administration (average 2.9%/annum), resulting in higher annual deficits and national debt levels.
U.S. deficits and national debt are the largest in the world by absolute amount, but not as a percent of GDP (reflecting the fact that the U.S. is the world’s largest economy).
Roughly two-thirds of the annual budget is non-discretionary, meaning it is fixed and is not subject to annual appropriations.
Deficits usually worsen in a recession and improve during periods of economic growth, but unusually, the deficits have grown larger during the Trump Administration even as the economy has grown.
The U.S. is in a unique position since the US dollar and US Treasuries are considered the ultimate safe haven assets. Even though the U.S. fiscal position has worsened over several years, investors – both domestic and foreign – have expressed their lack of concern as intermediate and long-term Treasury yields remain near record lows.
The assumptions which support the proposed Trump Administration federal budget for the 2021-2030 period can be found in Table S-9 on page 109 of the Trump Administration budget. Similar economic assumptions for the period 2020-2030 from the CBO can be found in their January 2020 report, available here, on page 76 in table B-2. I have contrasted the views of some of the key metrics in the table below.

The economic projections from the Trump Administration are extremely benign, and I really hope they turn out to be correct. However, I have doubts. My principal concern is with the projection for average annual real GDP growth over the next 10 years, which is aggressive compared to the last 10 years. For the period 4Q2009 to 4Q2019, real GDP growth averaged 2.3%/annum, significantly below the projections used by the Trump Administration (albeit higher than those used by the CBO). Remember, these last 10 years have been a period of largely uninterrupted economic growth in the U.S., and this is an unusually long period for there to have been no recession. Can we really expect this trend to continue for another 10 years? You can look at history and decide for yourself. I think that all presidential administrations, no matter which party is in power, prepare budgets with overly rosy economic expectations – it’s human nature I suppose. Rather than debate which set of projections will prove to be correct, because no one really knows, let’s then look quickly at the effect of the budget in each scenario (Trump Administration and CBO) on annual deficits and national debt levels. The tables below (split into two periods to make them easier to read) summarise the outlook for each.


The Trump Administration believes that budget deficits will gradually decrease during the next 10 years, from over $1 trillion (4.9% of GDP) this year to $261 billion (0.7% of GDP) by 2030. U.S. government debt (total) is projected to increase from $25.1 trillion this year (106.4% of GDP) to $30.6 trillion (83.6% of GDP) in 2030. The CBO expects a much different outcome, with deficits expected to increase (rather than shrink) throughout the period, and national debt to balloon to $36.2 trillion (113% of GDP) by 2030.
One thing to keep in mind is that an increasingly large portion of the federal budget is non-discretionary, meaning it is more or less fixed and is not subject to annual appropriations. This includes things like social security, Medicare, interest on national debt and similar expenditures. The mandatory – or non-discretionary – portion of the U.S. budget for 2021 is $3.3 trillion, or just over two-thirds of the total budget. This leaves the revenue side of the budget and around one-third of the federal expenditures in the hands of the government for annual appropriations.
The annual outlays this coming year are $4.8 trillion in the budget, a number so big it is hard to imagine. Unfortunately, federal receipts (mainly taxes) are expected to be only $3.9 trillion, leaving a hole of nearly $1 trillion. President Trump will have the dubious distinction this year (2020) of overseeing the largest federal deficit in the history of the United States, which the CBO expects to be near $1.1 trillion. That table below will give you a flavour of the major categories of expenditures and receipts in President Trump’s proposed 2021 budget.

As this table indicates, defence is the largest discretionary budget item (15.4% of expenditures), but mandatory entitlement programmes like Social Security, Medicare and Medicaid collectively account for nearly 50% of total expenditures. You will also see that interest on the national debt chews up 7.8% of the expense budget, an amount that will almost certainly be increasing in coming years. On the receipt side, individuals foot over 85% of receipts through individual income taxes and social security taxes.
The graph below shows the history of federal deficits in the U.S. over time. As you can see, the U.S. government largely operated at breakeven through the early 1970’s except for World War II. In fact, deficits didn’t really become a recurring theme until around 1980. Since then, every administration has run deficits with the exception of the Clinton Administration during his second term, when the U.S. government ran federal surpluses (1998 – 2001) during the latter stages of its long economic recovery that decade.

The graph above also depicts the usual countercyclical pattern of government deficits – they tend to worsen during economic downturns (recessions are the grey columns) and improve during periods of economic growth. What is unusual is for the deficit to be increasing like it has during the last three years, a period of economic growth rather than economic weakness. The reason why is simple – Congress approved The Tax Cuts and Jobs Act of 2017 in December 2017, and in spite of repeated assurances by the Trump Administration that the tax cuts would pay for themselves, this has not yet happened. Instead, the deficit and national debt have both reached record levels.
Absolute deficits in the U.S. might seem mind-blowing as they are the largest of any country in the world by some margin. However, you cannot forget that the U.S. is also the world’s largest economy, so it is more important to look at the annual deficit as a percentage of GDP. In this respect, the U.S. is not the highest. In fact, Japan has the highest ratio of deficit-to-GDP (5.8%) in the G-7, and Germany has the lowest (since Germany, unlike all other G7 countries, runs a surplus). The U.S. deficit-to-GDP is 4.6%, and the similar figure for the U.K. is 1.9%.
As a final point, let’s look quickly at national debt. The total U.S. national debt outstanding is currently around $23.3 trillion, which is 106.7% of GDP. You can see how the U.S. national debt grows second-by-second by looking at the official US debt clock. The graph below shows that the increase in national government debt of the U.S. over the last 55 years. Since reaching $2.5 trillion in 2Q1988, U.S. government debt has roughly doubled every 9 or 10 years.

As with deficits, the total national debt of a country is best assessed by comparing it to the size of its economy. Here's the trend in the U.S. - the table below shows debt-to-GDP over the last 55 years.
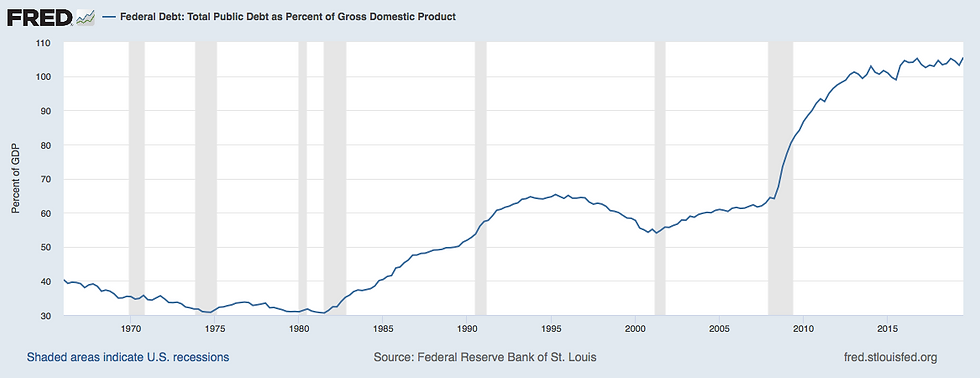
So how does the level of debt-to-GDP for the U.S. (106.7%) compare to other countries? Japan again has the distinction of having the highest such ratio in the world, at 237.5% (and total debt of around $9.1 trillion equivalent). Other countries that might interest you are: Italy, 133.4%; France, 99.2%; the U.K., 85.7%; Germany, 56.9%; and China, 55.4%.
This leaves us with the question: how the U.S. can halt and ideally reverse its spiralling debt problem without bringing the economy to its knees? That is a very good question, and a tough one. The obvious answer – raise taxes and / or cut expenditures to eventually move the country to surplus – is contractionary and would likely slow economic growth dramatically, potentially sending the economy into recession. Alternatively, I suppose the U.S. could inflate away its debt problem, since the best friend of fixed debt is inflation. However, many of the entitlement programmes in the government budget are indexed to inflation, making the effectiveness of this approach somewhat questionable. Or the U.S. could (continue to) monetise its debt, meaning printing vast sums of money for the Federal Reserve to to use to buy U.S. government debt. However, this has already occurred through three rounds of quantitative easing involving the Federal Reserve, and with it has come a long period of artificially low interest rates that has caused economic distortions (not to mention a Fed balance sheet of $4 trillion).
Given that there is no obvious solution, it looks like the U.S. will need to live with its huge amount of absolute debt for the time being, until perhaps there can be some budgetary manoeuvring to more quickly reduce the deficits, thereby slowing the growth in the national debt. As we saw at the end of the 1990’s, this would be most effective in a robust and growing economy, when there is less risk to the economy of moving to surplus. Until then, the size of the national debt is intimidating and a theoretical problem, but the reality is that U.S. government debt remains the ultimate global safe haven, the true “gold standard” of no-/low-risk assets. The world buys and supports U.S. debt of all maturities, and for this reason, we have never really seen a period of time during which the U.S. has paid for its growing annual deficits and higher government debt. Somehow, I hope the U.S. can eventually demonstrate the discipline, under the right economic circumstances, that is required to bring its debt under control before it is forced to do so by the global markets.
There is so much more to say about the U.S. budget, but this post is long enough. I hope it has provided you with some perspective.


Good information, but you neglected to discuss the Congressional process.